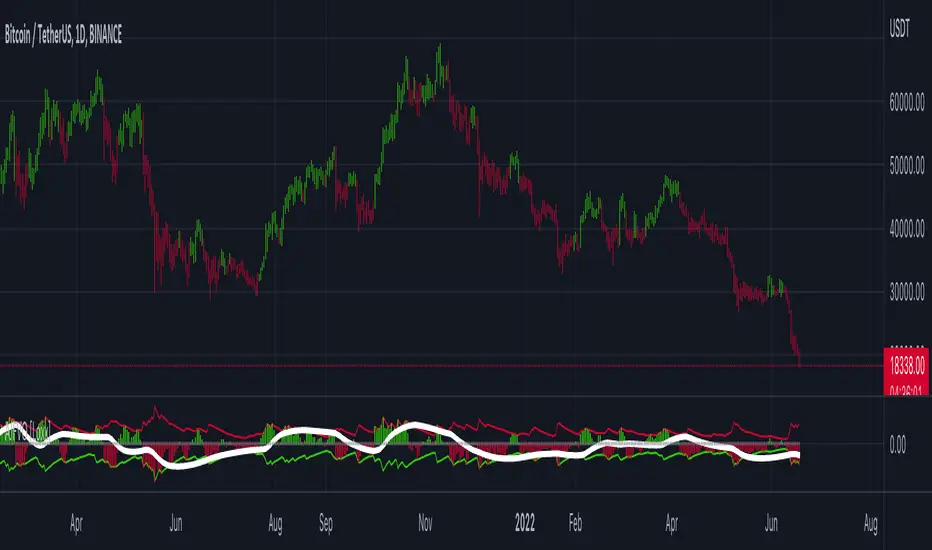
Adaptive Jurik Filter Volatility Oscillator [Loxx]Adaptive Jurik Filter Volatility Oscillator uses Jurik Volty and Adaptive Double Jurik Filter Moving Average (AJFMA) to derive Jurik Filter smoothed volatility.
What is Jurik Volty?
One of the lesser known qualities of Juirk smoothing is that the Jurik smoothing process is adaptive. "Jurik Volty" (a sort of market volatility ) is what makes Jurik smoothing adaptive. The Jurik Volty calculation can be used as both a standalone indicator and to smooth other indicators that you wish to make adaptive.
What is the Jurik Moving Average?
Have you noticed how moving averages add some lag (delay) to your signals? ... especially when price gaps up or down in a big move, and you are waiting for your moving average to catch up? Wait no more! JMA eliminates this problem forever and gives you the best of both worlds: low lag and smooth lines.
Ideally, you would like a filtered signal to be both smooth and lag-free. Lag causes delays in your trades, and increasing lag in your indicators typically result in lower profits. In other words, late comers get what's left on the table after the feast has already begun.
That's why investors, banks and institutions worldwide ask for the Jurik Research Moving Average ( JMA ). You may apply it just as you would any other popular moving average. However, JMA's improved timing and smoothness will astound you.
What is adaptive Jurik volatility?
One of the lesser known qualities of Juirk smoothing is that the Jurik smoothing process is adaptive. "Jurik Volty" (a sort of market volatility ) is what makes Jurik smoothing adaptive. The Jurik Volty calculation can be used as both a standalone indicator and to smooth other indicators that you wish to make adaptive.
What is an adaptive cycle, and what is Ehlers Autocorrelation Periodogram Algorithm?
From his Ehlers' book Cycle Analytics for Traders Advanced Technical Trading Concepts by John F. Ehlers , 2013, page 135:
"Adaptive filters can have several different meanings. For example, Perry Kaufman’s adaptive moving average ( KAMA ) and Tushar Chande’s variable index dynamic average ( VIDYA ) adapt to changes in volatility . By definition, these filters are reactive to price changes, and therefore they close the barn door after the horse is gone.The adaptive filters discussed in this chapter are the familiar Stochastic , relative strength index ( RSI ), commodity channel index ( CCI ), and band-pass filter.The key parameter in each case is the look-back period used to calculate the indicator. This look-back period is commonly a fixed value. However, since the measured cycle period is changing, it makes sense to adapt these indicators to the measured cycle period. When tradable market cycles are observed, they tend to persist for a short while.Therefore, by tuning the indicators to the measure cycle period they are optimized for current conditions and can even have predictive characteristics.
The dominant cycle period is measured using the Autocorrelation Periodogram Algorithm. That dominant cycle dynamically sets the look-back period for the indicators. I employ my own streamlined computation for the indicators that provide smoother and easier to interpret outputs than traditional methods. Further, the indicator codes have been modified to remove the effects of spectral dilation.This basically creates a whole new set of indicators for your trading arsenal."
Included
- UI options to color bars
"Relative Strength Index (RSI) " için komut dosyalarını ara
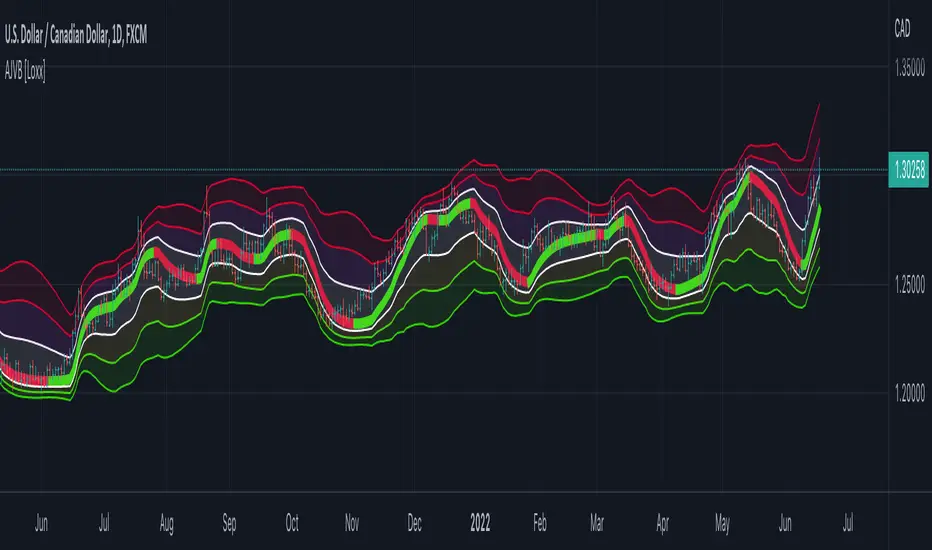
Adaptive Jurik Filter Volatility Bands [Loxx]Adaptive Jurik Filter Volatility Bands uses Jurik Volty and Adaptive, Double Jurik Filter Moving Average (AJFMA) to derive Jurik Filter smoothed volatility channels around an Adaptive Jurik Filter Moving Average. Bands are placed at 1, 2, and 3 deviations from the core basline.
What is Jurik Volty?
One of the lesser known qualities of Juirk smoothing is that the Jurik smoothing process is adaptive. "Jurik Volty" (a sort of market volatility ) is what makes Jurik smoothing adaptive. The Jurik Volty calculation can be used as both a standalone indicator and to smooth other indicators that you wish to make adaptive.
What is the Jurik Moving Average?
Have you noticed how moving averages add some lag (delay) to your signals? ... especially when price gaps up or down in a big move, and you are waiting for your moving average to catch up? Wait no more! JMA eliminates this problem forever and gives you the best of both worlds: low lag and smooth lines.
Ideally, you would like a filtered signal to be both smooth and lag-free. Lag causes delays in your trades, and increasing lag in your indicators typically result in lower profits. In other words, late comers get what's left on the table after the feast has already begun.
That's why investors, banks and institutions worldwide ask for the Jurik Research Moving Average ( JMA ). You may apply it just as you would any other popular moving average. However, JMA's improved timing and smoothness will astound you.
What is adaptive Jurik volatility?
One of the lesser known qualities of Juirk smoothing is that the Jurik smoothing process is adaptive. "Jurik Volty" (a sort of market volatility ) is what makes Jurik smoothing adaptive. The Jurik Volty calculation can be used as both a standalone indicator and to smooth other indicators that you wish to make adaptive.
What is an adaptive cycle, and what is Ehlers Autocorrelation Periodogram Algorithm?
From his Ehlers' book Cycle Analytics for Traders Advanced Technical Trading Concepts by John F. Ehlers , 2013, page 135:
"Adaptive filters can have several different meanings. For example, Perry Kaufman’s adaptive moving average ( KAMA ) and Tushar Chande’s variable index dynamic average ( VIDYA ) adapt to changes in volatility . By definition, these filters are reactive to price changes, and therefore they close the barn door after the horse is gone.The adaptive filters discussed in this chapter are the familiar Stochastic , relative strength index ( RSI ), commodity channel index ( CCI ), and band-pass filter.The key parameter in each case is the look-back period used to calculate the indicator. This look-back period is commonly a fixed value. However, since the measured cycle period is changing, it makes sense to adapt these indicators to the measured cycle period. When tradable market cycles are observed, they tend to persist for a short while.Therefore, by tuning the indicators to the measure cycle period they are optimized for current conditions and can even have predictive characteristics.
The dominant cycle period is measured using the Autocorrelation Periodogram Algorithm. That dominant cycle dynamically sets the look-back period for the indicators. I employ my own streamlined computation for the indicators that provide smoother and easier to interpret outputs than traditional methods. Further, the indicator codes have been modified to remove the effects of spectral dilation.This basically creates a whole new set of indicators for your trading arsenal."
Included
- UI options to shut off colors and bands
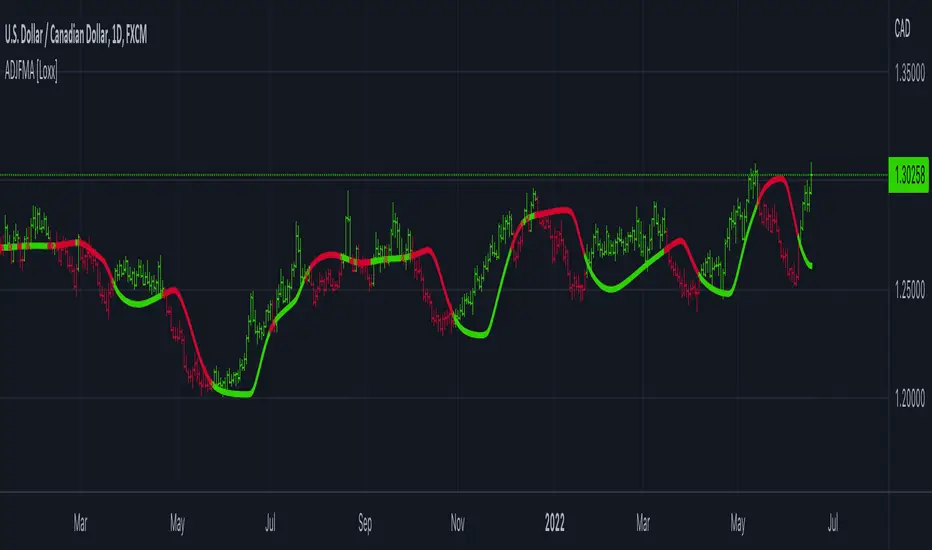
Adaptive, Double Jurik Filter Moving Average (AJFMA) [Loxx]Adaptive, Double Jurik Filter Moving Average (AJFMA) is moving average like Jurik Moving Average but with the addition of double smoothing and adaptive length (Autocorrelation Periodogram Algorithm) and power/volatility {Juirk Volty) inputs to further reduce noise and identify trends.
What is Jurik Volty?
One of the lesser known qualities of Juirk smoothing is that the Jurik smoothing process is adaptive. "Jurik Volty" (a sort of market volatility ) is what makes Jurik smoothing adaptive. The Jurik Volty calculation can be used as both a standalone indicator and to smooth other indicators that you wish to make adaptive.
What is the Jurik Moving Average?
Have you noticed how moving averages add some lag (delay) to your signals? ... especially when price gaps up or down in a big move, and you are waiting for your moving average to catch up? Wait no more! JMA eliminates this problem forever and gives you the best of both worlds: low lag and smooth lines.
Ideally, you would like a filtered signal to be both smooth and lag-free. Lag causes delays in your trades, and increasing lag in your indicators typically result in lower profits. In other words, late comers get what's left on the table after the feast has already begun.
That's why investors, banks and institutions worldwide ask for the Jurik Research Moving Average ( JMA ). You may apply it just as you would any other popular moving average. However, JMA's improved timing and smoothness will astound you.
What is adaptive Jurik volatility?
One of the lesser known qualities of Juirk smoothing is that the Jurik smoothing process is adaptive. "Jurik Volty" (a sort of market volatility ) is what makes Jurik smoothing adaptive. The Jurik Volty calculation can be used as both a standalone indicator and to smooth other indicators that you wish to make adaptive.
What is an adaptive cycle, and what is Ehlers Autocorrelation Periodogram Algorithm?
From his Ehlers' book Cycle Analytics for Traders Advanced Technical Trading Concepts by John F. Ehlers , 2013, page 135:
"Adaptive filters can have several different meanings. For example, Perry Kaufman’s adaptive moving average ( KAMA ) and Tushar Chande’s variable index dynamic average ( VIDYA ) adapt to changes in volatility . By definition, these filters are reactive to price changes, and therefore they close the barn door after the horse is gone.The adaptive filters discussed in this chapter are the familiar Stochastic , relative strength index ( RSI ), commodity channel index ( CCI ), and band-pass filter.The key parameter in each case is the look-back period used to calculate the indicator. This look-back period is commonly a fixed value. However, since the measured cycle period is changing, it makes sense to adapt these indicators to the measured cycle period. When tradable market cycles are observed, they tend to persist for a short while.Therefore, by tuning the indicators to the measure cycle period they are optimized for current conditions and can even have predictive characteristics.
The dominant cycle period is measured using the Autocorrelation Periodogram Algorithm. That dominant cycle dynamically sets the look-back period for the indicators. I employ my own streamlined computation for the indicators that provide smoother and easier to interpret outputs than traditional methods. Further, the indicator codes have been modified to remove the effects of spectral dilation.This basically creates a whole new set of indicators for your trading arsenal."
Included
- Double calculation of AJFMA for even smoother results
Adaptive, Jurik-Smoothed, Trend Continuation Factor [Loxx]Adaptive, Jurik-Smoothed, Trend Continuation Factor is a Trend Continuation Factor indicator with adaptive length and volatility inputs
What is the Trend Continuation Factor?
The Trend Continuation Factor (TCF) identifies the trend and its direction. TCF was introduced by M. H. Pee. Positive values of either the Positive Trend Continuation Factor (TCF+) and the Negative Trend Continuation Factor (TCF-) indicate the presence of a strong trend.
What is the Jurik Moving Average?
Have you noticed how moving averages add some lag (delay) to your signals? ... especially when price gaps up or down in a big move, and you are waiting for your moving average to catch up? Wait no more! JMA eliminates this problem forever and gives you the best of both worlds: low lag and smooth lines.
Ideally, you would like a filtered signal to be both smooth and lag-free. Lag causes delays in your trades, and increasing lag in your indicators typically result in lower profits. In other words, late comers get what's left on the table after the feast has already begun.
That's why investors, banks and institutions worldwide ask for the Jurik Research Moving Average ( JMA ). You may apply it just as you would any other popular moving average. However, JMA's improved timing and smoothness will astound you.
What is adaptive Jurik volatility?
One of the lesser known qualities of Juirk smoothing is that the Jurik smoothing process is adaptive. "Jurik Volty" (a sort of market volatility ) is what makes Jurik smoothing adaptive. The Jurik Volty calculation can be used as both a standalone indicator and to smooth other indicators that you wish to make adaptive.
What is an adaptive cycle, and what is Ehlers Autocorrelation Periodogram Algorithm?
From his Ehlers' book Cycle Analytics for Traders Advanced Technical Trading Concepts by John F. Ehlers , 2013, page 135:
"Adaptive filters can have several different meanings. For example, Perry Kaufman’s adaptive moving average ( KAMA ) and Tushar Chande’s variable index dynamic average ( VIDYA ) adapt to changes in volatility . By definition, these filters are reactive to price changes, and therefore they close the barn door after the horse is gone.The adaptive filters discussed in this chapter are the familiar Stochastic , relative strength index ( RSI ), commodity channel index ( CCI ), and band-pass filter.The key parameter in each case is the look-back period used to calculate the indicator. This look-back period is commonly a fixed value. However, since the measured cycle period is changing, it makes sense to adapt these indicators to the measured cycle period. When tradable market cycles are observed, they tend to persist for a short while.Therefore, by tuning the indicators to the measure cycle period they are optimized for current conditions and can even have predictive characteristics.
The dominant cycle period is measured using the Autocorrelation Periodogram Algorithm. That dominant cycle dynamically sets the look-back period for the indicators. I employ my own streamlined computation for the indicators that provide smoother and easier to interpret outputs than traditional methods. Further, the indicator codes have been modified to remove the effects of spectral dilation.This basically creates a whole new set of indicators for your trading arsenal."
Included
-Your choice of length input calculation, either fixed or adaptive cycle
-Bar coloring to paint the trend
Happy trading!

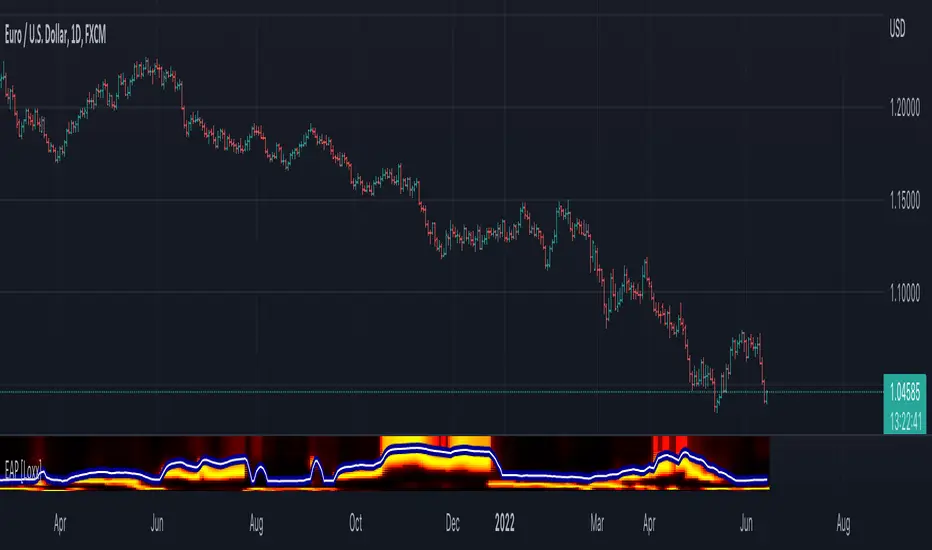
Ehlers Autocorrelation Periodogram [Loxx]Ehlers Autocorrelation Periodogram contains two versions of Ehlers Autocorrelation Periodogram Algorithm. This indicator is meant to supplement adaptive cycle indicators that myself and others have published on Trading View, will continue to publish on Trading View. These are fast-loading, low-overhead, streamlined, exact replicas of Ehlers' work without any other adjustments or inputs.
Versions:
- 2013, Cycle Analytics for Traders Advanced Technical Trading Concepts by John F. Ehlers
- 2016, TASC September, "Measuring Market Cycles"
Description
The Ehlers Autocorrelation study is a technical indicator used in the calculation of John F. Ehlers’s Autocorrelation Periodogram. Its main purpose is to eliminate noise from the price data, reduce effects of the “spectral dilation” phenomenon, and reveal dominant cycle periods. The spectral dilation has been discussed in several studies by John F. Ehlers; for more information on this, refer to sources in the "Further Reading" section.
As the first step, Autocorrelation uses Mr. Ehlers’s previous installment, Ehlers Roofing Filter, in order to enhance the signal-to-noise ratio and neutralize the spectral dilation. This filter is based on aerospace analog filters and when applied to market data, it attempts to only pass spectral components whose periods are between 10 and 48 bars.
Autocorrelation is then applied to the filtered data: as its name implies, this function correlates the data with itself a certain period back. As with other correlation techniques, the value of +1 would signify the perfect correlation and -1, the perfect anti-correlation.
Using values of Autocorrelation in Thermo Mode may help you reveal the cycle periods within which the data is best correlated (or anti-correlated) with itself. Those periods are displayed in the extreme colors (orange) while areas of intermediate colors mark periods of less useful cycles.
What is an adaptive cycle, and what is the Autocorrelation Periodogram Algorithm?
From his Ehlers' book mentioned above, page 135:
"Adaptive filters can have several different meanings. For example, Perry Kaufman’s adaptive moving average ( KAMA ) and Tushar Chande’s variable index dynamic average ( VIDYA ) adapt to changes in volatility . By definition, these filters are reactive to price changes, and therefore they close the barn door after the horse is gone.The adaptive filters discussed in this chapter are the familiar Stochastic , relative strength index ( RSI ), commodity channel index ( CCI ), and band-pass filter.The key parameter in each case is the look-back period used to calculate the indicator.This look-back period is commonly a fixed value. However, since the measured cycle period is changing, as we have seen in previous chapters, it makes sense to adapt these indicators to the measured cycle period. When tradable market cycles are observed, they tend to persist for a short while.Therefore, by tuning the indicators to the measure cycle period they are optimized for current conditions and can even have predictive characteristics.
The dominant cycle period is measured using the Autocorrelation Periodogram Algorithm. That dominant cycle dynamically sets the look-back period for the indicators. I employ my own streamlined computation for the indicators that provide smoother and easier to interpret outputs than traditional methods. Further, the indicator codes have been modified to remove the effects of spectral dilation.This basically creates a whole new set of indicators for your trading arsenal."
How to use this indicator
The point of the Ehlers Autocorrelation Periodogram Algorithm is to dynamically set a period between a minimum and a maximum period length. While I leave the exact explanation of the mechanic to Dr. Ehlers’s book, for all practical intents and purposes, in my opinion, the punchline of this method is to attempt to remove a massive source of overfitting from trading system creation–namely specifying a look-back period. SMA of 50 days? 100 days? 200 days? Well, theoretically, this algorithm takes that possibility of overfitting out of your hands. Simply, specify an upper and lower bound for your look-back, and it does the rest. In addition, this indicator tells you when its best to use adaptive cycle inputs for your other indicators.
Usage Example 1
Let's say you're using "Adaptive Qualitative Quantitative Estimation (QQE) ". This indicator has the option of adaptive cycle inputs. When the "Ehlers Autocorrelation Periodogram " shows a period of high correlation that adaptive cycle inputs work best during that period.
Usage Example 2
Check where the dominant cycle line lines, grab that output number and inject it into your other standard indicators for the length input.
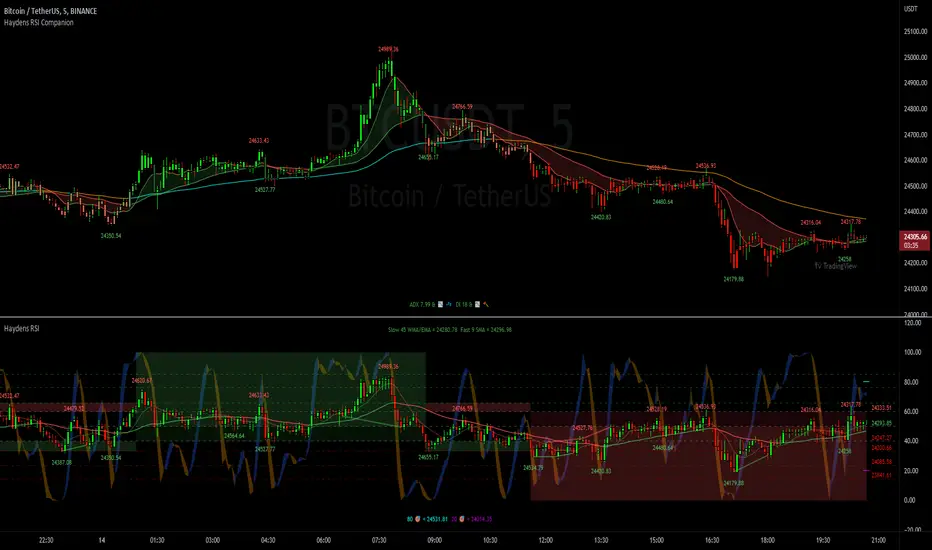
Haydens RSI CompanionPreface: I'm just the bartender serving today's freshly blended concoction; I'd like to send a massive THANK YOU to all the coders and PineWizards for the locally-sourced ingredients. I am simply a code editor, not a code author. The book that inspired this indicator is a free download, plus all of the pieces I used were free code from the community; my hope is that any additional useful development of The Complete RSI is also offered open-source to the community for collaboration.
Features: Fibonacci retracement plus targets. Advanced dual data ticker. Heiken Ashi or bar overlay. Hayden, BarefootJoey, Tradingview, or Custom watermark of choice. Trend lines for spotting wedges, triangles, pennants, etc. Divergences for spotting potential reversals and Momentum Discrepancy Reversal Point opportunities. Percent change and price pivot labels with advanced data & retracement targets upon hover.
‼ IMPORTANT: Hover over labels for advanced information, like targets. Google & read John Hayden's "The Complete RSI" pdf book for comprehensive instructions before attempting to trade with this indicator. Always keep an eye on higher/stronger timeframes. See the companion oscillator here:
⚠ DISCLAIMER: DYOR. Not financial advice. Not a trading system. I am not affiliated with TradingView or John Hayden; this is my own personally PineScripted presentation of a suitable RSI chart companion to use when trading according to Hayden's rules.
About the Editor: I am a former-FINRA Registered Representative, inventor/patent-holder, and self-taught PineScripter. I mostly code on a v3 Pinescript level so expect heavy scripts that could use some shortening with modern conventions.
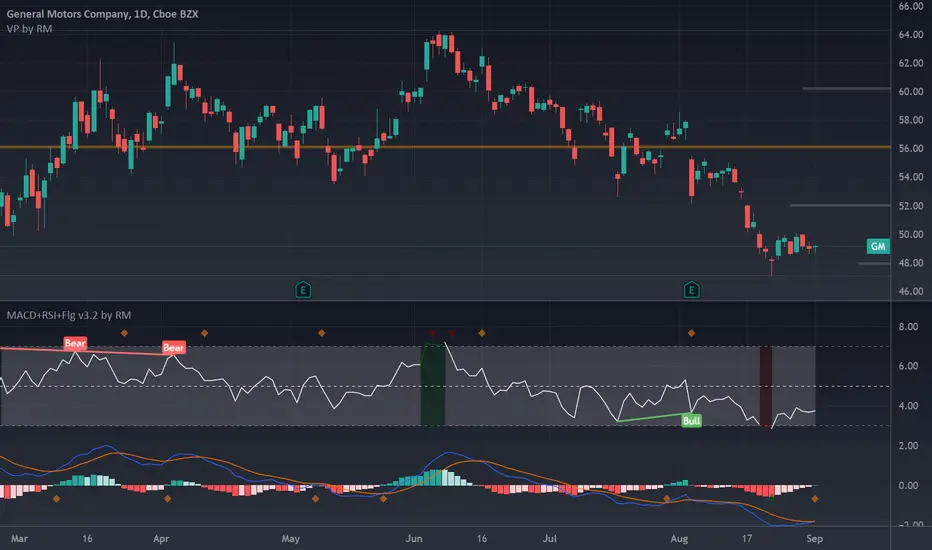
MACD+RSI+Flag v2 by RMThis source code is subject to the terms of the Mozilla Public License 2.0 at mozilla.org
There are a number of very clever people I have taken bits of code and ideas, thanks to you all :) © raul3429
www.investopedia.com
RSI: The relative strength index (RSI) is a momentum indicator measures recent price changes to evaluate overbought or oversold conditions.
MACD: Moving average convergence divergence (MACD) is a trend-following momentum indicator that shows the relationship between two moving averages of a security’s price. The MACD is = 12EMA - 26EMA, The histogram represent this difference.
Notes:
This code has Flags for first candle change during oversold/overbought shown as triangles, also and MACD 12 and MACD 26 crossings as diamonds. These are sometimes indicators of trend change.
RSI has been scaled down by "scaleRSI" parameter to enable plotting alongside MACD
Depending on the security being evaluated the RSI scale may need to be adjusted as the MACD ranges vary between symbols.
Disclaimer:
This is not a Financial advisory tool. For education purposes only. Use at your own risk.
[Alerts]QQE Cross v6.0 by JustUncleLDescription:
This is a major upgrade of my original QQE indicator Tool, this version is directed at Forex and Crypto Margin trading. This version can also be used with AutoView/ProfitView Chrome add-on in a semi-automatic (turn on only when conditions are favorable) or automatic way, with Signal to Signal or Signal to Close trading.
This is a Trend following indicator that uses fast QQE crosses to capture swings in direction of the main Trend. Alerts are filtered with Two Moving Average Ribbons and/or Direction of MAs. The QQE or Qualitative Quantitative Estimation is based on the relative strength index (RSI), but uses a smoothing technique as an additional transformation. Three crosses can be selected (all selected by default):
Smooth RSI signal crossing ZERO (XZ)
Smooth RSI signal crossing Fast QQE line (XQ), this is like an early warning swing signal.
Smooth RSI signal exiting the RSI Threshhold Channel (XC), this is like a confirmed swing signal. An optimal Smooth RSI threshold level is between 5% and 10% (default=10), it helps reduce the false swings.
These signals can be selected to Open Short/Long and/or Close a trade, default is XC open trade and XQ (or opposite open) to Close trade.
The (LONG/SHORT) alerts can be optionally filtered by the Moving Average Ribbons:
For LONG alert the Close must be above the fast MA Ribbon and fast MA Ribbon must be above the slow MA Ribbon.
For SHORT alert the Close must be below the fast MA Ribbon and fast MA Ribbon must be below the slow MA Ribbon.
and/or directional filter:
For LONG alert the Close must be above the medium MA and the directional of both MA ribbons must be Bullish.
For SELL alert the Close must be below the medium MA and the directional of both MA ribbons must be Bearish.
This indicator is designed to be used as a Signal to Signal trading BOT in automatic or semi-automatic way (start and stop when conditions are suitable).
For LONG and SHORT alerts I recommend you use "Once per Bar" alarm option
For CLOSE alerts I recommend you use "Once per Bar Close" alarm option
(* The script has been designed so that long/short signals come at start of candles *)
(* and close signals come at the end of candles *)

Renko RSI (Brick-Triggered, Red/Green Only) MODIFIEDhe Renko RSI (Brick-Triggered, Red/Green Only) Modified indicator is a specialized trading tool designed for use with Renko charts, which focus solely on price movements rather than time. This modified version enhances the traditional Renko RSI by triggering signals based on brick formations (price blocks) and uses only red and green colors to indicate trend direction—green for bullish (upward) trends and red for bearish (downward) trends. It integrates the Relative Strength Index (RSI) to identify potential reversals or continuations when Renko bricks change direction, filtering out market noise for clearer trend analysis. The indicator is tailored to highlight high-probability entry and exit points, making it suitable for traders seeking a simplified, visual approach to spotting trends and reversals, especially on assets like crypto on short timeframes such as 15-minute or 1-hour charts.

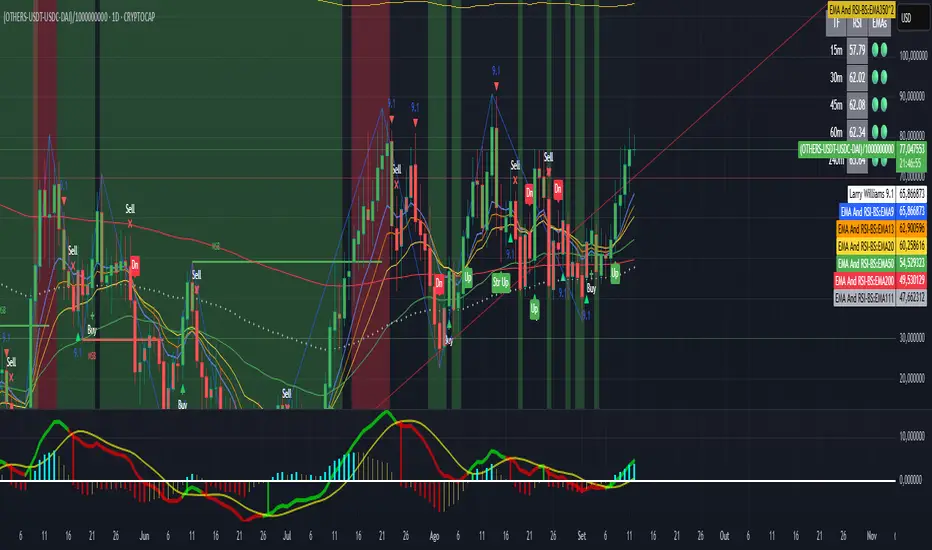
EMA Oracle and RSIEMA Oracle
- “See the market’s structure through the eyes of exponential wisdom.”
combines classic EMA stacks with Pi-based logic to reveal high-probability buy/sell zones and trend bias across timeframes
Multi-EMA Trend & Pi Signal Indicator
This advanced indicator combines classic trend analysis with Pi-based signal logic to help traders identify optimal entry and exit zones across multiple timeframes.
Core Features
EMA Trend Structure: Displays EMAs 9, 13, 20, 50, and 200 to visualize short-term and long-term trend orientation. Bullish momentum is indicated when shorter EMAs are stacked above longer ones.
Pi-Based Signal Logic: Inspired by the Pi Indicator, it includes EMA111 and EMA700 (350×2) on the daily chart:
Buy Zone: When price is trading below EMA111, it signals potential accumulation for spot or low-leverage position trades.
Sell Zone: When price is above EMA700, it suggests potential distribution or exit zones.
Trend Cross Alerts: Detects EMA crossovers and crossunders to highlight shifts in market structure and generate buy/sell signals.
Multi-Timeframe Analysis: Evaluates trend direction across selected timeframes (e.g., 15m, 30m, 1h, 4h, 1D), offering a broader market perspective.
RSI Integration: Combines Relative Strength Index (RSI) readings with EMA positioning to assess momentum and overbought/oversold conditions.
Trend Table Display: A dynamic table summarizes the asset’s trend status per timeframe, showing:
RSI values
EMA alignment
Overall trend bias (bullish, bearish, neutral)
Volatility Momentum Breakout StrategyDescription:
Overview:
The Volatility Momentum Breakout Strategy is designed to capture significant price moves by combining a volatility breakout approach with trend and momentum filters. This strategy dynamically calculates breakout levels based on market volatility and uses these levels along with trend and momentum conditions to identify trade opportunities.
How It Works:
1. Volatility Breakout:
• Methodology:
The strategy computes the highest high and lowest low over a defined lookback period (excluding the current bar to avoid look-ahead bias). A multiple of the Average True Range (ATR) is then added to (or subtracted from) these levels to form dynamic breakout thresholds.
• Purpose:
This method helps capture significant price movements (breakouts) while ensuring that only past data is used, thereby maintaining realistic signal generation.
2. Trend Filtering:
• Methodology:
A short-term Exponential Moving Average (EMA) is applied to determine the prevailing trend.
• Purpose:
Long trades are considered only when the current price is above the EMA, indicating an uptrend, while short trades are taken only when the price is below the EMA, indicating a downtrend.
3. Momentum Confirmation:
• Methodology:
The Relative Strength Index (RSI) is used to gauge market momentum.
• Purpose:
For long entries, the RSI must be above a mid-level (e.g., above 50) to confirm upward momentum, and for short entries, it must be below a similar threshold. This helps filter out signals during overextended conditions.
Entry Conditions:
• Long Entry:
A long position is triggered when the current closing price exceeds the calculated long breakout level, the price is above the short-term EMA, and the RSI confirms momentum (e.g., above 50).
• Short Entry:
A short position is triggered when the closing price falls below the calculated short breakout level, the price is below the EMA, and the RSI confirms momentum (e.g., below 50).
Risk Management:
• Position Sizing:
Trades are sized to risk a fixed percentage of account equity (set here to 5% per trade in the code, with each trade’s stop loss defined so that risk is limited to approximately 2% of the entry price).
• Stop Loss & Take Profit:
A stop loss is placed a fixed ATR multiple away from the entry price, and a take profit target is set to achieve a 1:2 risk-reward ratio.
• Realistic Backtesting:
The strategy is backtested using an initial capital of $10,000, with a commission of 0.1% per trade and slippage of 1 tick per bar—parameters chosen to reflect conditions faced by the average trader.
Important Disclaimers:
• No Look-Ahead Bias:
All breakout levels are calculated using only past data (excluding the current bar) to ensure that the strategy does not “peek” into future data.
• Educational Purpose:
This strategy is experimental and provided solely for educational purposes. Past performance is not indicative of future results.
• User Responsibility:
Traders should thoroughly backtest and paper trade the strategy under various market conditions and adjust parameters to fit their own risk tolerance and trading style before live deployment.
Conclusion:
By integrating volatility-based breakout signals with trend and momentum filters, the Volatility Momentum Breakout Strategy offers a unique method to capture significant price moves in a disciplined manner. This publication provides a transparent explanation of the strategy’s components and realistic backtesting parameters, making it a useful tool for educational purposes and further customization by the TradingView community.

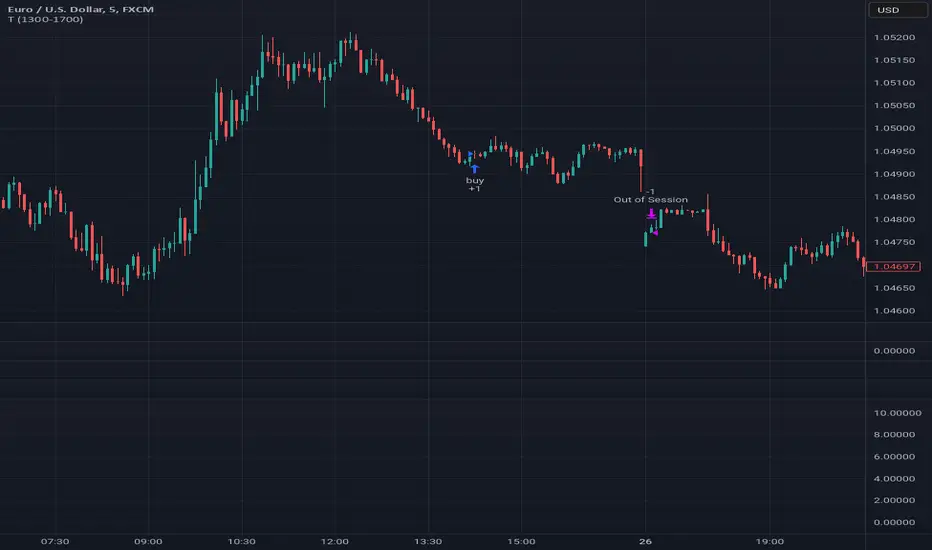
Tutorial - Adding sessions to strategiesA simple script to illustrate how to add sessions to trading strategies.
In this interactive tutorial, you'll learn how to add trading sessions to your strategies using Pine Script. By the end of this session (pun intended!), you'll be able to create custom trading windows that adapt to changing market conditions.
What You'll Learn:
Defining Trading Sessions: Understand how to set up specific time frames for buying and selling, tailored to your unique trading style.
RSI-Based Entry Signals: Discover how to use the Relative Strength Index (RSI) as a trigger for buy and sell signals, helping you capitalize on market trends.
Combining Session Logic with Trading Decisions: Learn how to integrate session-based logic into your strategy, ensuring that trades are executed only during designated times.
By combining these elements, we create an interactive strategy that:
1. Generates buy and sell signals based on RSI levels.
2. Checks if the market is open during a specific trading session (e.g., 1300-1700).
3. Executes trades only when both conditions are met.
**Tips & Variations:**
* Experiment with different RSI periods, thresholds, and sessions to optimize your strategy for various markets and time frames.
* Consider adding more advanced logic, such as stop-losses or position sizing, to further refine your trading approach.
Get ready to take your Pine Script skills to the next level!
~Description partially generated with Llama3_8B
Precision Trading Strategy: Golden EdgeThe PTS: Golden Edge strategy is designed for scalping Gold (XAU/USD) on lower timeframes, such as the 1-minute chart. It captures high-probability trade setups by aligning with strong trends and momentum, while filtering out low-quality trades during consolidation or low-volatility periods.
The strategy uses a combination of technical indicators to identify optimal entry points:
1. Exponential Moving Averages (EMAs): A fast EMA (3-period) and a slow EMA (33-period) are used to detect short-term trend reversals via crossover signals.
2. Hull Moving Average (HMA): A 66-period HMA acts as a higher-timeframe trend filter to ensure trades align with the overall market direction.
3. Relative Strength Index (RSI): A 12-period RSI identifies momentum. The strategy requires RSI > 55 for long trades and RSI < 45 for short trades, ensuring entries are backed by strong buying or selling pressure.
4. Average True Range (ATR): A 14-period ATR ensures trades occur only during volatile conditions, avoiding choppy or low-movement markets.
By combining these tools, the PTS: Golden Edge strategy creates a precise framework for scalping and offers a systematic approach to capitalize on Gold’s price movements efficiently.

Time Appliconic Macro | ForTF5m (Fixed)The Time Appliconic Macro (TAMcr) is a custom-built trading indicator designed for the 5-minute time frame (TF5m), providing traders with clear Buy and Sell signals based on precise technical conditions and specific time windows.
Key Features:
Dynamic Moving Average (MA):
The indicator utilizes a Simple Moving Average (SMA) to identify price trends.
Adjustable length for user customization.
Custom STARC Bands:
Upper and lower bands are calculated using the SMA and the Average True Range (ATR).
Includes a user-defined multiplier to adjust the band width for flexibility across different market conditions.
RSI Integration:
Signals are filtered using the Relative Strength Index (RSI), ensuring they align with overbought/oversold conditions.
Time-Based Signal Filtering:
Signals are generated only during specific time windows, allowing traders to focus on high-activity periods or times of personal preference.
Supports multiple custom time ranges with automatic adjustments for UTC-4 or UTC-5 offsets.
Clear Signal Visualization:
Buy Signals: Triggered when the price is below the lower band, RSI indicates oversold conditions, and the time is within the defined range.
Sell Signals: Triggered when the price is above the upper band, RSI indicates overbought conditions, and the time is within the defined range.
Signals are marked directly on the chart for easy identification.
Customizability:
Adjustable parameters for the Moving Average length, ATR length, and ATR multiplier.
Time zone selection and defined trading windows provide a tailored experience for global users.
Who is this Indicator For?
This indicator is perfect for intraday traders who operate in the 5-minute time frame and value clear, filtered signals based on price action, volatility, and momentum indicators. The time window functionality is ideal for traders focusing on specific market sessions or personal schedules.
How to Use:
Adjust the MA and ATR parameters to match your trading style or market conditions.
Set the desired time zone and time ranges to align with your preferred trading hours.
Monitor the chart for Buy (green) and Sell (red) signals, and use them as a guide for entering or exiting trades.
Trade 1 + StatergyThe Relative Strength Index (RSI) is a momentum oscillator used in technical analysis that measures the speed and change of price movements of a security within a range of 0 to 100. It is most commonly set to a 14-period timeframe and helps traders identify overbought or oversold conditions, suggesting potential reversal points in the market. Divergence occurs when the price trend and the RSI trend move in opposite directions. A bullish divergence signals potential upward movement when prices are making new lows while the RSI makes higher lows. Conversely, a bearish divergence suggests a possible downward trend when prices are making new highs but the RSI is making lower highs. These signals are crucial for traders looking to capture shifts in momentum and adjust their trading strategies accordingly.
use full to
5 min
10 min
15 min decition
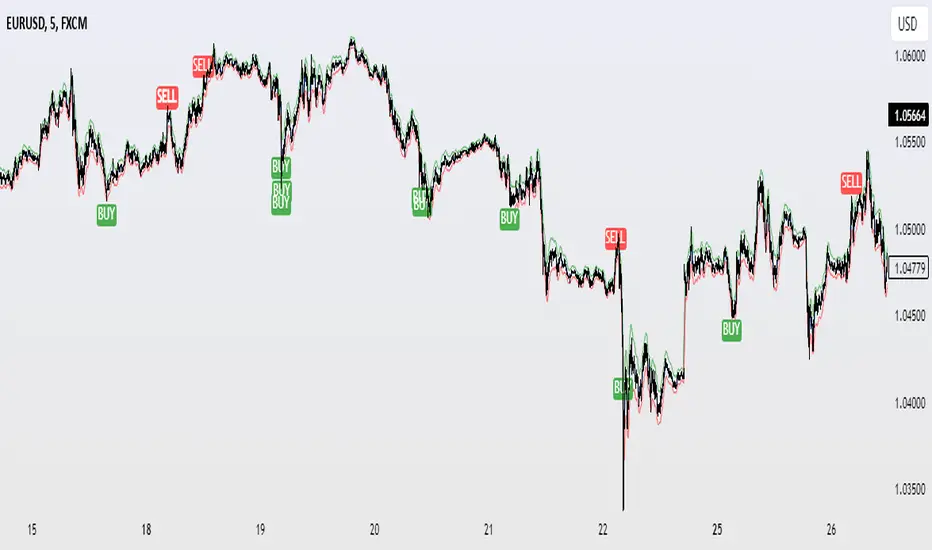
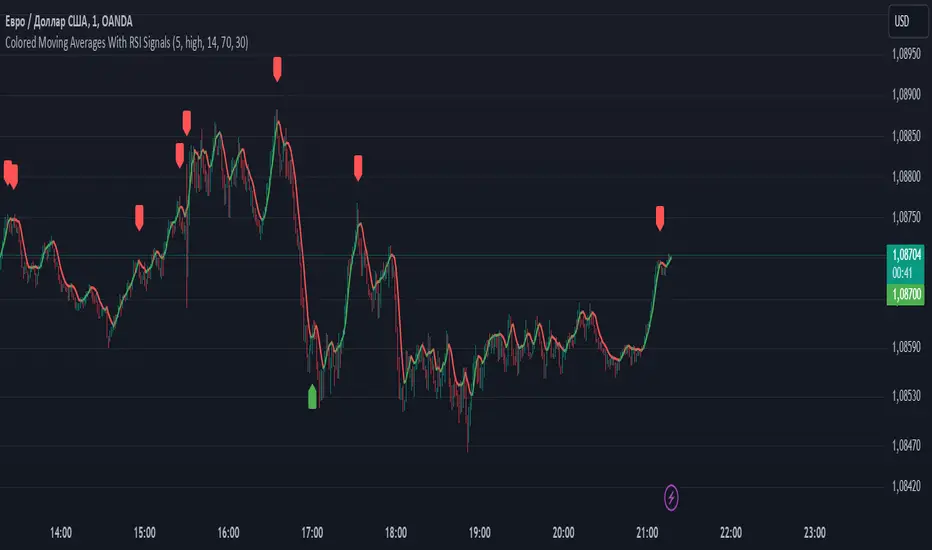
Colored Moving Averages With RSI SignalsMoving Average (MA):
Helps to determine the overall market trend. If the price is above the MA, it may indicate an uptrend, and if below, a downtrend.
In this case, a Simple Moving Average (SMA) is used, but other types can be applied as well.
Relative Strength Index (RSI):
This is an oscillator that measures the speed and changes of price movements.
Values above 70 indicate overbought conditions (possible sell signal), while values below 30 indicate oversold conditions (possible buy signal).
Purpose of This Indicator:
Trading Signals: The indicator generates "Buy" and "Sell" signals based on the intersection of the price line and the moving average, as well as RSI values. This helps traders make more informed decisions.
Signal Filtering: Using RSI in combination with MA allows for filtering false signals since it considers not only the current trend but also the state of overbought or oversold conditions.
How to Use:
For Short-Term Trading: Traders can use buy and sell signals to enter trades based on short-term market fluctuations.
In Combination with Other Indicators: It can be combined with other indicators for a more comprehensive analysis (e.g., adding support and resistance levels).
Overall, this indicator helps traders respond more quickly and accurately to changes in market conditions, enhancing the chances of successful trades.
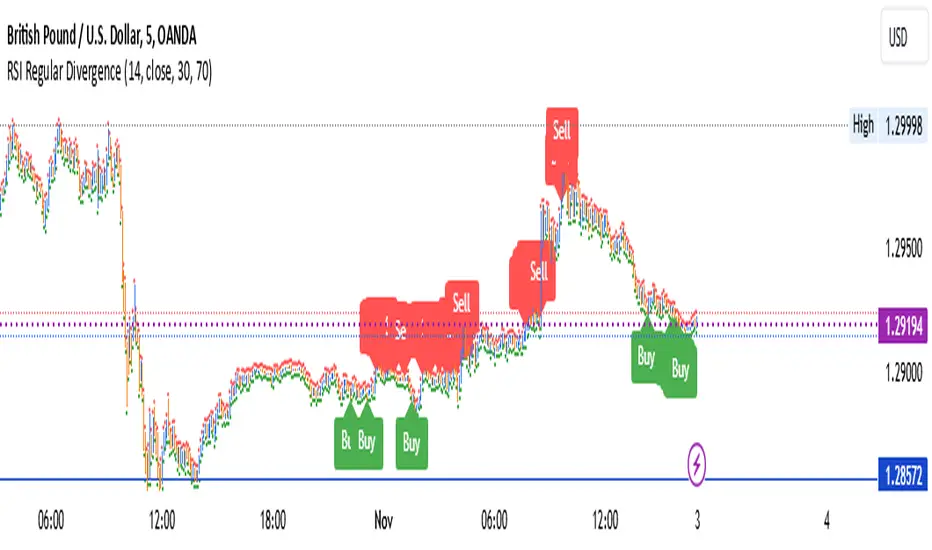
Confluence StrategyOverview of Confluence Strategy
The Confluence Strategy in trading refers to the combination of multiple technical indicators, support/resistance levels, and chart patterns to identify high-probability trading opportunities. The idea is that when several indicators agree on a price movement, the likelihood of that movement being successful increases.
Key Components
Technical Indicators:
Moving Averages (MA): Commonly used to determine the trend direction. Look for crossovers (e.g., the 50-day MA crossing above the 200-day MA).
Relative Strength Index (RSI): Helps identify overbought or oversold conditions. A reading above 70 may indicate overbought conditions, while below 30 suggests oversold.
MACD (Moving Average Convergence Divergence): Useful for spotting changes in momentum. Look for MACD crossovers and divergence from price.
Support and Resistance Levels:
Identify key levels where price has historically reversed. These can be drawn from previous highs/lows, Fibonacci retracement levels, or psychological price levels.
Chart Patterns:
Patterns like head and shoulders, double tops/bottoms, or flags can indicate potential reversals or continuations in price.
Strategy Implementation
Set Up Your Chart:
Add the desired indicators (e.g., MA, RSI, MACD) to your TradingView chart.
Mark significant support and resistance levels.
Identify Confluence Points:
Look for situations where multiple indicators align. For instance, if the price is near a support level, the RSI is below 30, and the MACD shows bullish divergence, this may signal a buying opportunity.
Entry and Exit Points:
Entry: Place a trade when your confluence conditions are met. Use limit orders for better prices.
Exit: Set profit targets based on resistance levels or use trailing stops. Consider the risk-reward ratio to ensure your trades are favorable.
Risk Management:
Always implement stop-loss orders to protect against unexpected market moves. Position size should reflect your risk tolerance.
Example of a Confluence Trade
Setup:
Price approaches a strong support level.
RSI shows oversold conditions (below 30).
The 50-day MA is about to cross above the 200-day MA (bullish crossover).
Action:
Enter a long position as the conditions align.
Set a stop loss just below the support level and a take profit at the next resistance level.
Conclusion
The Confluence Strategy can significantly enhance trading accuracy by ensuring that multiple indicators support a trade decision. Traders on TradingView can customize their indicators and charts to fit their personal trading styles, making it a flexible approach to technical analysis.

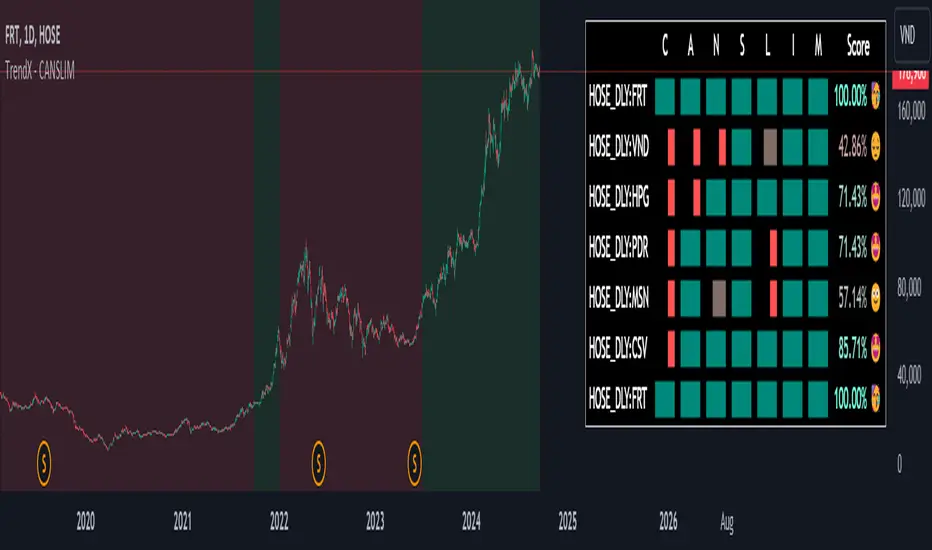
CANSLIM Screener [TrendX_]INTRODUCTION:
The CANSLIM investment strategy, developed by William J. O'Neil, is a powerful tool for identifying growth stocks that have the potential to outperform the market. TrendX has enhanced this approach with its unique indicators, making it easier for investors to assess stocks based on seven critical criteria.
➊ C: Current Quarterly EPS or PE with Growth Benchmark
The first criterion focuses on the Earnings Per Share (EPS) growth in the most recent quarter compared to previous quarters. A company should demonstrate significant EPS growth, ideally exceeding expectations and benchmarks within its industry.
➋ A: Average Annual EPS Growth with Growth Benchmark
This aspect evaluates a company's average annual EPS growth over the last three years. A consistent upward trend suggests that the company is effectively increasing its profitability. TrendX provides a customizable benchmark to help investors identify firms with sustainable growth trajectories.
➌ N: New Highs or New Product Development
TrendX interprets this criterion through an Annual Research & Development to Revenue Ratio (RNDR). A decreasing RNDR ratio may indicate that a company is finishing new products, which could lead to reduced revenue if product launches are unsuccessful.
➍ S: Supply and Demand
This component assesses supply and demand dynamics by analyzing the movement of Float Shares Outstanding. A decrease in float shares typically indicates higher demand for the stock, suggesting that the company is in good shape for future growth.
➎ L: Leader
TrendX employs comparative analysis between the Relative Strength Index (RSI) of a company and that of the overall market. If a company's RSI is higher than the market's, it signifies that the stock is leading rather than lagging.
➏ I: Institutional Sponsorship
Institutional sponsorship is gauged through the total dividends paid by a company. High dividend payouts can signal strong institutional interest, support and confidence in the company's future prospects.
➐ M: Market Direction
TrendX evaluates market direction by comparing a company's RSI against its Moving Average of RSI, along with utilizing Market Structure in Smart Money Concept indicator for alternative trend insights.
HOW TO USE
The TrendX CANSLIM indicator provides an evaluation score based on each of the seven criteria outlined above, which displays in a table containing:
Scoring System: Each letter in CANSLIM contributes to a total score out of 100%. A stock does not need to meet all seven criteria; achieving a score above 70% (5 out of 7) is generally considered indicative of a promising growth stock.
Screening Feature: The tool includes a screening feature that evaluates multiple stocks simultaneously, allowing investors to compare their CANSLIM scores efficiently. This feature streamlines identifying potential investment opportunities across various sectors.
DISCLAIMER
This indicator is not financial advice, it can only help traders make better decisions. There are many factors and uncertainties that can affect the outcome of any endeavor, and no one can guarantee or predict with certainty what will occur.
Therefore, one should always exercise caution and judgment when making decisions based on past performance.
Keltner Channel+EMA with Buy/Sell SignalsIndicator Name: Double Keltner Channel with EMA (Buy/Sell Signals)
Description:
This indicator is designed to help traders identify potential trend reversals and generate buy/sell signals in volatile markets. It combines two Keltner Channels with different sensitivities (multipliers of 2.6 and 3.8) to visualize dynamic support and resistance levels. The addition of a 20-period EMA helps confirm trend direction and filter out potential false signals.
How the Indicator Works:
• Keltner Channels: These bands dynamically adjust to changing market volatility, offering a visual representation of potential price ranges. The 2.6 multiplier Keltner Channel (KC) is more sensitive to price changes, potentially highlighting short-term reversals, while the 3.8 multiplier KC focuses on broader trend shifts.
• 20-period EMA: This widely used trend indicator helps smooth out price fluctuations and identify the underlying direction of the market.
• Buy Signals: Generated when a candle's low touches or crosses below either Keltner Channel's lower band, and within the next 6 candles, that same candle closes above the 20 EMA. This combination suggests a potential rejection of lower prices (support) and a possible resumption of the uptrend.
• Sell Signals: Mirror the buy signal logic but are triggered when the candle's high touches or crosses above either Keltner Channel's upper band and then closes below the 20 EMA within the next 6 candles. This indicates a potential rejection of higher prices (resistance) and a possible shift to a downtrend.
How to Use the Indicator:
1. Identify the Trend: Use the 20 EMA to determine the overall trend direction. Look for buy signals primarily in uptrends and sell signals in downtrends.
2. Confirm with RSI : While not included in this indicator, consider using a separate Relative Strength Index (RSI) with a length of 10, SMA type, MA length of 14, and standard deviation of 2. Look for oversold conditions (RSI below 20) to confirm buy signals and overbought conditions (RSI above 80) to confirm sell signals.
3.Apply Risk Management: Always use appropriate risk management techniques, such as stop-loss orders, to protect your capital.
Key Points:
• This indicator is most effective in trending markets.
• It is not a standalone trading system and should be used in conjunction with other analysis tools and confirmation.
• The Keltner Channel multiplier values can be adjusted to suit your trading style and risk tolerance.
Important Disclaimer:
This indicator is a modification of the original Keltner Channel code and is intended for educational and informational purposes only.
It does not constitute financial advice. Always conduct your own research and consult with a qualified financial advisor before making any investment decisions.

Supertrend + BB + Consecutive Candles + QQE + EMA [Pineify]Overview
This indicator, developed by Pineify, is a comprehensive tool designed to assist traders in making informed decisions by combining multiple technical analysis methods. It integrates Supertrend, Bollinger Bands (BB), Consecutive Candles, Quantitative Qualitative Estimation (QQE), and Exponential Moving Averages (EMA) into a single, cohesive script. This multi-faceted approach allows traders to analyze market trends, volatility, and potential buy/sell signals with greater accuracy.
Key Features
1. Supertrend: Utilizes the Supertrend indicator to identify the prevailing market trend. It provides clear buy and sell signals based on the direction of the trend.
2. Bollinger Bands (BB): Measures market volatility and identifies overbought or oversold conditions. The script calculates the middle, upper, and lower bands, along with the Bollinger Band Width (BBW) and Bollinger Band %B (BBR).
3. Consecutive Candles: Detects sequences of consecutive bullish or bearish candles, providing signals when a specified number of consecutive candles are detected.
4. Quantitative Qualitative Estimation (QQE): Combines the Relative Strength Index (RSI) with a smoothing factor to generate buy and sell signals based on the QQE methodology.
5. Exponential Moving Averages (EMA): Includes both fast and slow EMAs to identify potential crossovers, which are used as buy and sell signals.
How It Works
- Supertrend: The Supertrend indicator is calculated using a factor and ATR length. It plots the trend direction and generates buy/sell signals when the trend changes.
- Bollinger Bands: The BB indicator calculates the middle band as a Simple Moving Average (SMA) of the closing prices. The upper and lower bands are derived by adding and subtracting a multiple of the standard deviation from the middle band.
- Consecutive Candles: This feature counts the number of consecutive candles that close higher or lower than the previous candle. When the count reaches a specified threshold, it generates a buy or sell signal.
- QQE: The QQE indicator smooths the RSI values and calculates the QQE Fast and QQE Slow lines. Buy and sell signals are generated based on the crossover of these lines.
- EMA: The script calculates fast and slow EMAs and generates buy/sell signals based on their crossovers.
How to Use
1. Inputs: Customize the indicator settings through the input parameters:
- Supertrend Factor and ATR Length
- BB Length
- Consecutive Candles Counting
- QQE RSI Length
- Fast and Slow EMA Lengths
- Enable/Disable Alerts for various signals
2. Alerts: Set up alerts for Supertrend, Consecutive Candles, and EMA crossovers. Alerts can be enabled or disabled based on user preference.
3. Visualization: The indicator plots the Supertrend, Bollinger Bands, and EMA lines on the chart. It also marks buy and sell signals with arrows and labels for easy identification.
Concepts Underlying Calculations
- Supertrend: Based on the Average True Range (ATR) to determine the trend direction and potential reversal points.
- Bollinger Bands: Utilizes standard deviation to measure market volatility and identify overbought/oversold conditions.
- Consecutive Candles: A method to detect momentum by counting consecutive bullish or bearish candles.
- QQE: Enhances the traditional RSI by smoothing it and using a dynamic threshold to generate signals.
- EMA: A widely used moving average that gives more weight to recent prices, making it responsive to market changes.
This indicator is a powerful tool for traders looking to combine multiple technical analysis methods into a single, easy-to-use script. By integrating these diverse techniques, it provides a comprehensive view of market conditions and potential trading opportunities.

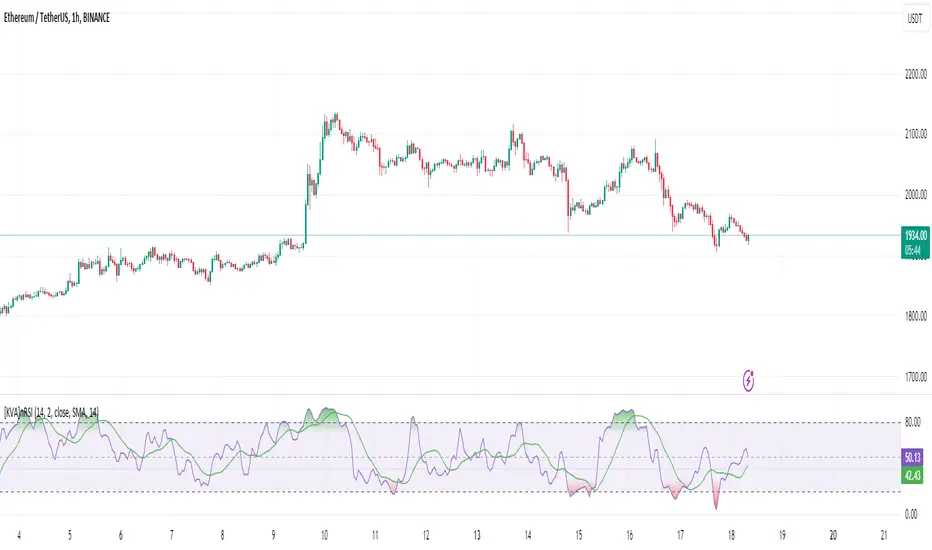
[KVA]nRSIThe nRSI stands as a groundbreaking enhancement of the traditional Relative Strength Index (RSI), specifically engineered for traders seeking a more refined and accurate tool in fast-moving markets.
Customizable Price Change Period (n): Unlike the traditional RSI which solely relies on a fixed period for average gains and losses, the nRSI introduces an additional parameter, n, to calculate price changes.
This adaptation focuses on minimizing market noise, sharpening the indicator's sensitivity to genuine trends and patterns.
Enhanced Signal Precision : By reducing the influence of short-term price spikes and fluctuations, the nRSI delivers a more precise signal. This precision is particularly crucial in volatile market conditions, where traditional indicators may be swayed by transient movements.
Ideal Usage
Strategic Trading Decisions : Ideal for traders who need to filter out insignificant price movements to make more strategic, informed trading decisions.
Reliable Divergence Spotting : Enhanced noise reduction aids in identifying more reliable divergences, key for predicting potential market reversals.
Trend Confirmation : The smoothed RSI, assisted by the moving average, becomes an invaluable tool for confirming the validity of market trends, minimizing false signals.
EMA Power BandsHello!
Today, I am delighted to introduce you to the "EMA Power Bands" indicator, designed to assist in identifying buying and selling points for assets moving in the markets.
Key Features of the Indicator:
EMA Bands: "EMA Power Bands" utilizes Exponential Moving Average (EMA) to create trend lines. These bands automatically expand or contract based on the price trend, adapting to market conditions.
ATR-Based Volatility: The indicator measures price volatility using the Average True Range (ATR) indicator, adjusting the width of the EMA bands accordingly. As a result, wider bands form during periods of increased volatility, while they narrow during lower volatility.
RSI-Based Buy-Sell Signals: "EMA Power Bands" uses the Relative Strength Index (RSI) to identify overbought and oversold zones. Entering the overbought zone generates a sell signal, while entering the oversold zone produces a buy signal.
Trend Direction Identification: The indicator assists in determining the price trend direction by analyzing the slope of the EMA bands. This allows you to identify periods of uptrends and downtrends.
Visualization of Buy-Sell Signals: "EMA Power Bands" visually marks the buy and sell signals:
- When RSI enters the overbought zone, it displays a sell signal (🪫).
- When RSI enters the oversold zone, it indicates a buy signal (🔋).
- When a candle closes above the emaup line, it displays a bearish signal (🔨).
- When a candle closes below the emadw line, it indicates a bullish signal (🚀).
By using the "EMA Power Bands" (EMA Güç Bantları) indicator, especially in trend-following strategies and periods of volatility, you can make more informed and disciplined trading decisions. However, I recommend using it in conjunction with other technical analysis tools and fundamental data.
*You can also use it with CCI as an example.
With this indicator, you can identify potential trend reversals in advance and strengthen your risk management strategies.
So, go ahead and try the "EMA Power Bands" (EMA Güç Bantları) indicator to enhance your technical analysis skills and make more informed trading decisions!

Exhaustion Improved Scalping Consolidation and Squeeze IndicatorThis custom indicator, called " Exhaustion & Improved Scalping Consolidation and Squeeze Indicator," is designed to help traders identify potential trading opportunities in the context of price consolidations, squeezes, and momentum exhaustion. It is an overlay indicator that combines several popular technical analysis tools, including the Relative Strength Index (RSI), Moving Average Convergence Divergence (MACD), Bollinger Bands, Keltner Channels, and Rate of Change (ROC). By analyzing these metrics, the indicator aims to provide visual cues on price charts to support better decision-making in the markets.
Use Case for Trading:
Consolidation Detection: The indicator identifies periods of price consolidation, which typically occur when a market is experiencing low volatility and trading in a narrow range. During these periods, the RSI value is between 45 and 55, the MACD histogram is close to zero, and the ROC value is low. The indicator highlights these consolidation periods by coloring the price bars yellow. Traders can use this information to anticipate potential breakouts and prepare for a possible trend initiation.
Squeeze Detection: The indicator detects squeezes by comparing the Bollinger Bands and Keltner Channels. A squeeze occurs when the Bollinger Bands are within the Keltner Channels, indicating that price volatility is decreasing. The indicator colors the price bars orange during a squeeze, which can be a signal for traders to watch for an upcoming increase in volatility and potential trend expansion.
Momentum Exhaustion Detection: The indicator identifies exhaustion in momentum by analyzing the RSI and MACD histogram. When the RSI is above 70, indicating overbought conditions, and the MACD histogram is decreasing, it may signal that the current upward momentum is losing strength. The indicator colors the price bars white in these situations. Traders can use this information to potentially exit long positions or prepare for a trend reversal.
